


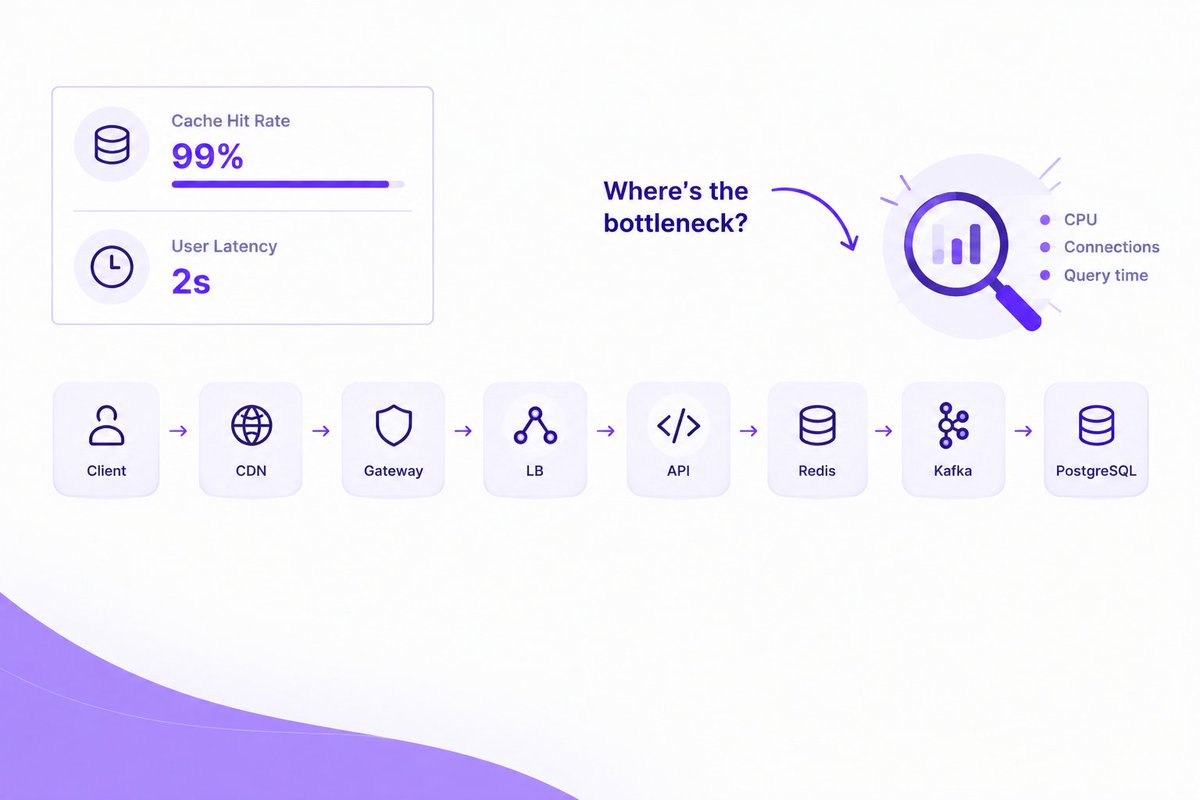
Your cache hit rate is 99%. Users are STILL seeing 2s latency. What are you checking next? No new components. Think bottleneck. #SystemDesign #BackendEngineering #Scalability t.co/Is1mHJEPeK
- 2 réponses
- 2 partages
- 4 j'aime
- 101 vues
Your cache hit rate is 99%. Users are STILL seeing 2s latency. What are you checking next? No new components. Think bottleneck. #SystemDesign #BackendEngineering #Scalability t.co/Is1mHJEPeK
@team_scaledojo I'd check p95/p99 instead of average latency. A 99% cache hit rate could hide a smaller percentage of very slow requests that are disproportionately affecting user experience.
@SanhitaDawn Exactly. Averages can hide the pain. I'd want p50, p95 and p99 broken down by endpoint and request type.
@team_scaledojo I'd trace a slow request end-to-end. First break the 2s into network → application → cache → downstream calls → response serialization and find exactly where the time is going.
@simanta_sarma_ That's the approach I'd take too: don't assume the cache is the bottleneck just because we're talking about cache hit rate. Trace the 2 seconds.
Your API has a 2s SLA. It calls 3 services in sequence. Each call has a 5s timeout. What's wrong? How should timeouts work across a call chain? #SystemDesign #Timeouts #Microservices t.co/QSSGrzp5MQ
